
The year at a glance
2015 in figures
- Net sales rose 11% to SEK 115,316m (104,054).
- Organic sales growth, which excludes exchange rate effects, acquisitions and divestments, was 5%.
- Operating profit, excluding items affecting comparability, rose 10% to SEK 13,014m (11,849).
- The operating margin, excluding items affecting comparability, was 11.3% (11.4%, 11.1% excluding gains on forest swaps).
- Profit before tax, excluding items affecting comparability, rose 11% to SEK 12,059m (10,888).
- Earnings per share amounted to SEK 9.97 (9.40).
- The return on capital employed, excluding items affecting comparability, was 12.0% (11.2%).
- The return on equity, excluding items affecting comparability, was 11.6% (11.9%).
- Cash flow from current operations amounted to SEK 9,890m (8,149).
- The Board of Directors proposes an increase in the dividend by 9.5% to SEK 5.75 (5.25) per share.
Key events in 2015
- To further intensify the focus on the Group’s two main operations, SCA decided to initiate a dividing of the Group into two divisions: a Hygiene division and a Forest Products division.
- Decision to further enhance the hygiene organization. This change took effect on January 1, 2016.
- Decision to invest in a new production facility in Brazil for the manufacture of incontinence products.
- Decision to invest in increased capacity for pulp production at the Östrand pulp mill in Sweden.
- SCA qualified for inclusion in the Dow Jones Sustainability World Index and the Dow Jones Sustainability Europe Index, and was named industry leader in the Household Products sector.
- Decision to make a public bid on Wausau Paper Corp., one of the largest AfH tissue companies in the North American market. The transaction was completed on January 21, 2016.
- Decision to divest the business in Southeast Asia, Taiwan and South Korea for integration with Vinda. SCA is the majority shareholder in Vinda, one of China’s largest hygiene companies.
- As part of the cost-savings program related to the acquisition of Georgia-Pacific’s European tissue operations, a tissue production plant in France was closed.
- Decision to close down a newsprint machine at the Ortviken paper mill in Sweden.
Group
|
2015 |
|
2014 |
||||||||||||
|
SEK |
|
EUR 2) |
|
SEK |
|
EUR 2) |
||||||||
|
|||||||||||||||
Net sales, SEKm/EURm |
115,316 |
|
12,334 |
|
104,054 |
|
11,449 |
||||||||
Operating profit, SEKm/EURm |
10,947 4) |
|
1,171 |
|
10,449 |
|
1,150 |
||||||||
Operating profit, SEKm/EURm 1) |
13,014 |
|
1,392 |
|
11,849 |
|
1,304 |
||||||||
Operating margin, % |
9 |
|
|
|
10 |
|
|
||||||||
Operating margin, % 1) |
11 |
|
|
|
11 |
|
|
||||||||
Profit before tax, SEKm/EURm |
9,992 |
|
1,069 |
|
9,488 |
|
1,044 |
||||||||
Profit before tax, SEKm/EURm 1) |
12,059 |
|
1,290 |
|
10,888 |
|
1,198 |
||||||||
Profit for the year, SEKm/EURm |
7,452 |
|
797 |
|
7,068 |
|
778 |
||||||||
Profit for the year, SEKm/EURm 1) |
8,753 |
|
936 |
|
8,244 |
|
907 |
||||||||
Earnings per share, SEK |
9.97 |
|
|
|
9.40 |
|
|
||||||||
Earnings per share, SEK 1) |
11.82 |
|
|
|
11.07 |
|
|
||||||||
Cash flow from current operations per share, SEK |
14.08 |
|
|
|
11.60 |
|
|
||||||||
Equity per share, SEK |
107.35 |
|
|
|
103 |
|
|
||||||||
Dividend, SEK |
5.75 3) |
|
|
|
5.25 |
|
|
||||||||
Strategic capital expenditures, including acquisitions, SEKm/EURm |
–3,218 |
|
–344 |
|
–2,324 |
|
–256 |
||||||||
Divestments, SEKm/EURm |
329 |
|
35 |
|
206 |
|
23 |
||||||||
Equity, SEKm/EURm |
75,691 |
|
8,290 |
|
72,872 |
|
7,643 |
||||||||
Return on capital employed, % |
10 |
|
|
|
10 |
|
|
||||||||
Return on capital employed, % 1) |
12 |
|
|
|
11 |
|
|
||||||||
Return on equity, % |
10 |
|
|
|
10 |
|
|
||||||||
Return on equity, % 1) |
12 |
|
|
|
12 |
|
|
||||||||
Debt/equity ratio |
0.39 |
|
|
|
0.49 |
|
|
||||||||
Debt/equity ratio, excluding pension liabilities |
0.36 |
|
|
|
0.42 |
|
|
||||||||
Average number of employees |
44,051 |
|
|
|
44,247 |
|
|
||||||||
Number of employees at Dec. 31 |
44,000 |
|
|
|
43,772 |
|
|
||||||||
Cash flow from current operations
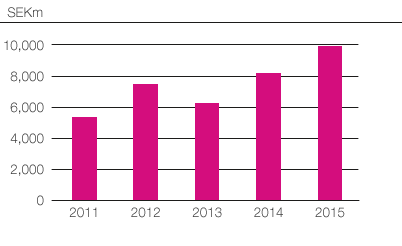
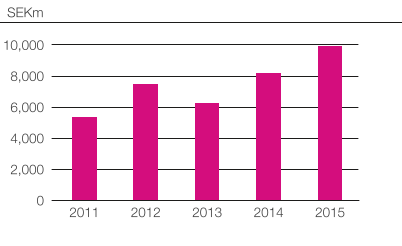
2012 and 2013 restated in accordance with IFRS 10 and 11.
Net sales and operating margin
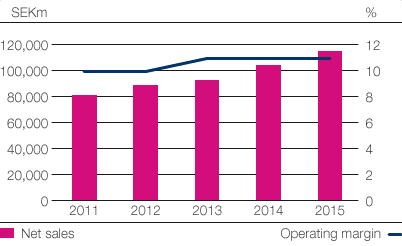
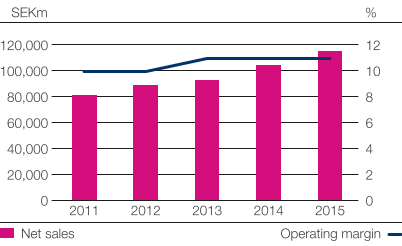
Excluding items affecting comparability.
2012 and 2013 restated in accordance with IFRS 10 and 11.
+10%
increase in operating profit in 2015, excluding items affecting comparability, compared with the preceding year.
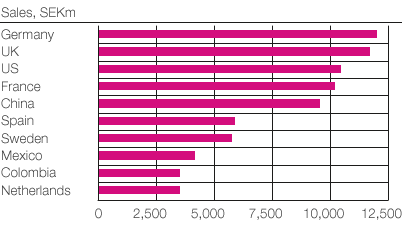
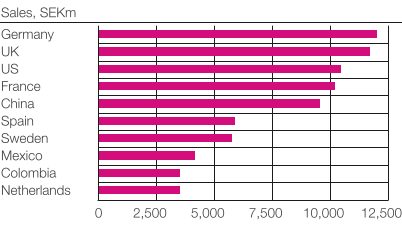
Group’s largest markets
Profit before tax and dividend per share
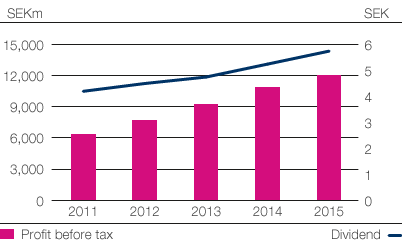
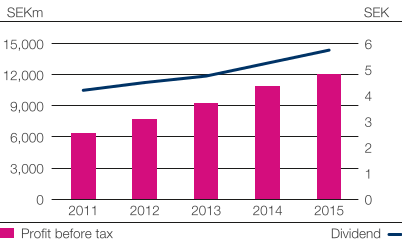
Profit excluding items affecting comparability.
2012 and 2013 restated in accordance with IFRS 10 and 11.
SCA’s sales by region
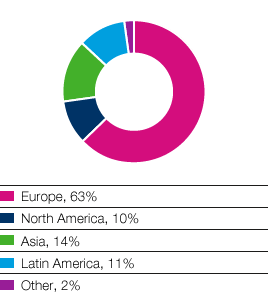
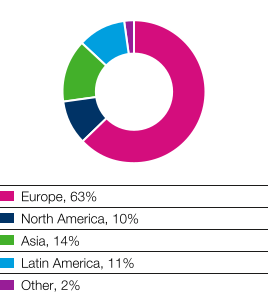
Net sales (share of Group)
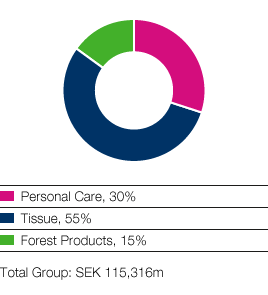
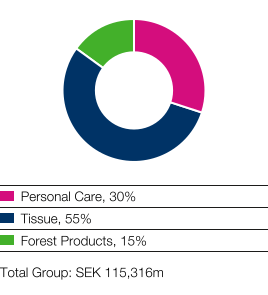
Operating profit (share of Group)
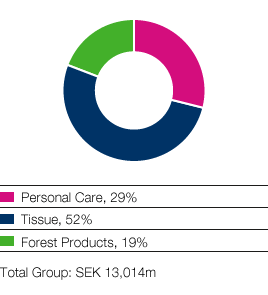
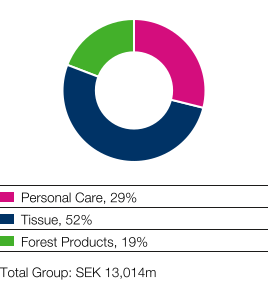
Excluding items affecting comparability.