Operations in 2016
Net sales
SEK 16,587m
Adjusted operating profit1)
SEK 2,211m
Adjusted operating margin1)
13.3%
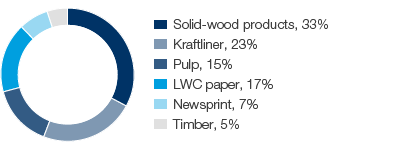
Net sales decreased by 4% to SEK 16,587m (17,279). Organic sales, which exclude exchange rate effects, acquisitions and divestments, decreased by 3%, of which price/mix accounted for –3% and volume for 0%. The closure of a publication paper machine during the fourth quarter of 2015 decreased net sales by 3%. Exchange rate effects decreased net sales by 1%.
Solid-wood products showed lower prices (including exchange rate effects) and higher volumes. Pulp and kraftliner showed lower prices (including exchange rate effects) and lower volumes. Publication papers showed higher prices (including exchange rate effects) and lower volumes.
The adjusted operating profit1) decreased by 15% to SEK 2,211m (2,605). Lower prices (including exchange rate effects) and higher energy costs had a negative earnings effect. Lower distribution costs and raw material costs had a positive earnings effect.
The adjusted return on capital employed1) was 5.7% (6.9).
The operating cash surplus amounted to SEK 2,639m (3,319). Operating cash flow amounted to SEK 1,884m (2,501).
Capital expenditures amounted to SEK 3,190m (1,815).
Targets
- To grow in line with the market
- Return on capital employed is to be in the top quartile of the industry over a business cycle.
Outcome 2016
Organic sales
–3%
Adjusted return on capital employed1)
5.7%
1) Excluding items affecting comparability.
Net sales by product segment

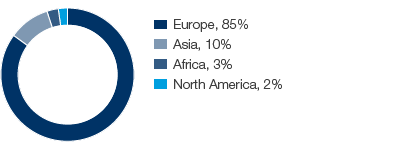
Net sales by region

|
SEKm |
2016 |
2015 |
||
|
||||
|
Net sales |
16,587 |
17,279 |
||
|
of which internal |
511 |
482 |
||
|
Operating cash surplus |
2,639 |
3,319 |
||
|
Change in working capital |
119 |
95 |
||
|
Current capital expenditures, net |
–959 |
–869 |
||
|
Other operating cash flow |
85 |
–44 |
||
|
Operating cash flow |
1,884 |
2,501 |
||
|
Adjusted operating profit 1) |
2,211 |
2,605 |
||
|
Adjusted operating margin, % 1) |
13.3 |
15.1 |
||
|
Capital employed |
40,109 |
37,216 |
||
|
Adjusted return on capital employed, % 1) |
5.7 |
6.9 |
||
|
Strategic capital expenditures |
|
|
||
|
plant and equipment |
–2,231 |
–946 |
||
|
company acquisitions/divestments |
112 |
279 |
||
|
Average number of employees |
4,275 |
4,153 |
||
|
No. of employees at Dec. 31 |
4,165 |
4,276 |
||
Net sales and adjusted operating margin1)
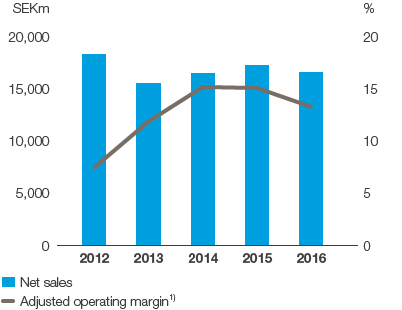

1) Excluding items affecting comparability.
2012 and 2013 restated in accordance with IFRS 10 and 11.
Adjusted return on capital employed1)
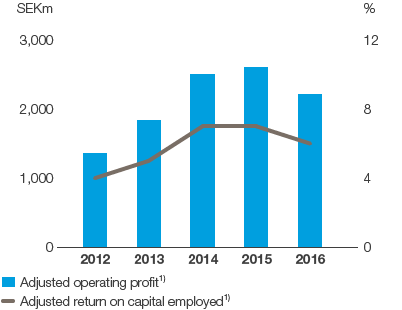

1) Excluding items affecting comparability.
2012 and 2013 restated in accordance with IFRS 10 and 11.