C2. Personnel data
|
2016 |
2015 |
2014 |
|
|
|
|
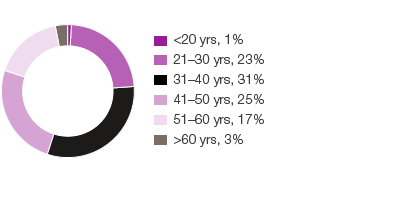
Employees under 20 years of age, % |
1 |
1 |
2 |
Employees over 60 years of age, % |
3 |
3 |
3 |
Investments in skills-enhancement activities |
|
|
|
total, SEKm |
160 |
157 |
130 |
per employee, SEK |
3,500 |
3,500 |
2,900 |
Value added per employee, KSEK |
662 |
668 |
614 |
Proportion of university graduates, % |
22 |
22 |
20 |
Number of employees who left the Group during the period |
6,328 |
5,600 |
8,355 |
Number of employees who joined the Group during the period |
8,432 |
5,988 |
7,319 |
The figures for the number of employees who left the Group during the period include both voluntary resignation and retirements. In addition, a significant portion relates to summer jobs for students and seasonal work.
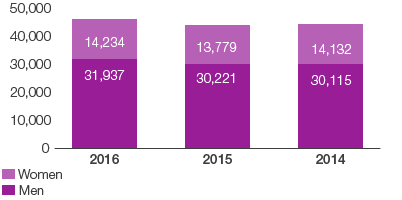
Average number of employees

Age distribution 2016

In 2016, SCA had employees in 60 countries (61; 62). Women comprised 38% (39; 21) of the total number of SCA Board members and senior executives.