Financial position
Assets and capital employed
The Group’s total assets increased 9% compared with the preceding year, amounting to SEK 165,748m (152,372). Non-current assets rose SEK 13,503m compared with the preceding year to SEK 124,745m, of which property, plant and equipment increased SEK 8,303m to SEK 92,954m and intangible assets increased SEK 4,155m to SEK 27,007m. Current and strategic capital expenditures in property, plant and equipment amounted to SEK 9,798m and depreciation for the year to SEK 5,861m.
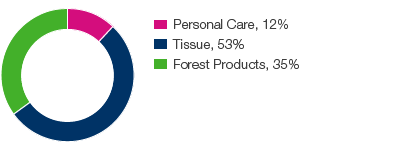
Current assets decreased SEK 127m to SEK 41,003m (41,130). Working capital amounted to SEK 6,883m (8,167). Capital employed was 9% higher and totaled SEK 114,880m (105,169). The distribution of capital employed per currency is shown in the table below.
The value denominated in SEK of the Group’s foreign net assets amounted to SEK 61,009m at year end. In 2015, the Group’s foreign net assets totaled SEK 62,196m.
Equity
The Group’s consolidated equity amounted to SEK 79,519m (75,691) at year end. Profit for the period increased equity by SEK 6,012m (7,452), while shareholder dividends reduced equity by SEK 4,228m (3,903). Equity was reduced due to the fair value measurement of pension assets, and an update of the assumptions and assessments that influence the valuation of pension obligations, net, by SEK 1,114m after tax. The measurement of financial instruments to fair value increased equity by SEK 564m after tax. Exchange rate movements, including the effect of hedges of net foreign investments, after tax, increased equity by SEK 2,312m. Equity increased as a result of a private placement to non-controlling interests in Vinda by SEK 431m and decreased due to the acquisition of non-controlling interests by SEK 156m. Other items increased equity by SEK 7m.
Financing
The Group’s interest-bearing gross debt amounted to SEK 36,716m (33,822) at year-end. The maturity period was 3.9 (3.4) years.
Net debt amounted to SEK 35,361m (29,478) at year-end. Net cash flow increased net debt by SEK 3,784m. Fair value measurement of pension assets and an update of the assumptions and assessments that influence the valuation of pension obligations, net, together with fair valuation of financial instruments, increased net debt by SEK 1,526m. The effect of fair value measurement is largely attributable to assumptions of a lower discount rate that increases pension liabilities. Exchange rate movements increased net debt by SEK 573m.
Key figures
The debt/equity ratio was 0.44 (0.39). Excluding pension liabilities, the debt/equity ratio was 0.39 (0.36). The visible equity/assets ratio was 44% (46). Adjusted return on capital employed and equity1) was 12.5% (12.0) and 11.0% (11.6) respectively. The capital turnover rate was 1.05 (1.06). At year-end, working capital amounted to 6% (7) of net sales.
1) Excluding items affecting comparability
|
2016 |
% |
2015 |
% |
2014 |
% |
EUR |
25,420 |
22 |
24,097 |
23 |
31,037 |
29 |
SEK |
39,661 |
35 |
39,464 |
38 |
36,337 |
33 |
USD |
14,419 |
13 |
7,124 |
7 |
7,192 |
7 |
GBP |
4,783 |
4 |
4,879 |
5 |
5,452 |
5 |
Other |
30,597 |
26 |
29,605 |
27 |
28,801 |
26 |
Total |
114,880 |
100 |
105,169 |
100 |
108,819 |
100 |
SEKm |
2016 |
2015 |
2014 |
Intangible assets |
27,007 |
22,852 |
23,680 |
Property, plant and equipment |
62,184 |
54,532 |
56,345 |
Biological assets |
30,770 |
30,119 |
29,685 |
Other non-current assets |
4,784 |
3,739 |
5,775 |
Total non-current assets |
124,745 |
111,242 |
115,485 |
Current assets |
41,003 |
41,130 |
39,251 |
Total assets |
165,748 |
152,372 |
154,736 |
Equity |
79,519 |
75,691 |
72,872 |
Non-current liabilities |
50,274 |
36,481 |
40,347 |
Current liabilities |
35,955 |
40,200 |
41,517 |
Total equity and liabilities |
165,748 |
152,372 |
154,736 |
Working capital |
6,883 |
8,167 |
8,350 |
Capital employed |
114,880 |
105,169 |
108,819 |
Net debt |
35,361 |
29,478 |
35,947 |
Net debt, debt/equity ratio and debt payment capacity
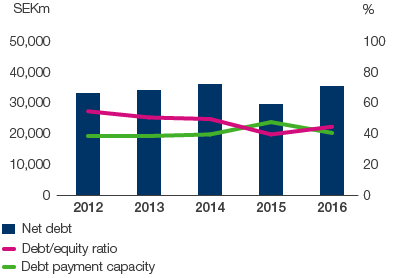

2012 and 2013 restated in accordance with IFRS 10 and 11.
Adjusted return on capital employed and equity1)
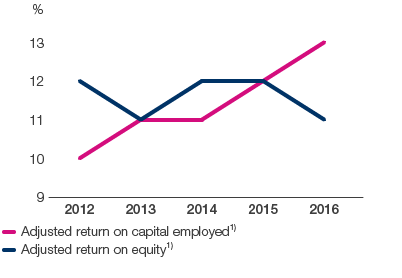

1) Excluding items affecting comparability.
2012 and 2013 restated in accordance with IFRS 10 and 11.
Capital employed, share of Group