Operations in 2016
Net sales
SEK 33,651m
Adjusted operating profit1)
SEK 4,255m
Adjusted operating margin1)
12.6%
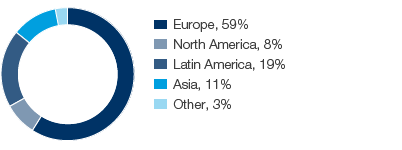
Net sales decreased by 2% to SEK 33,651m (34,344). Organic sales, which exclude exchange rate effects, acquisitions and divestments, increased by 3%, of which volume accounted for 2% and price/mix for 1%. The divestment of the baby diaper business in South Africa decreased net sales by 1%. Organic sales increased by 2% in mature markets and by 3% in emerging markets. Emerging markets accounted for 41% of net sales. Exchange rate effects decreased net sales by 4%.
For incontinence products, under the globally leading TENA brand, organic sales increased by 2%. Growth is attributable to emerging markets and Western Europe. For baby diapers, organic sales decreased by 1%. Western Europe showed high growth, while sales in emerging markets decreased. For feminine care products, organic sales increased by 10%, attributable to emerging markets and Western Europe.
The adjusted operating profit1) rose 7% (10% excluding currency translation effects and divestments) to SEK 4,255m (3,990). Profit was favorably affected by higher volumes, a better price/mix and cost savings. Higher raw material costs had a negative earnings effect. Selling costs were higher, and investments were made in increased marketing activities. The British pound and Mexican peso have weakened against several trading currencies, which had a negative earnings effect.
The adjusted operating margin1) was 12.6% (11.6).
The adjusted return on capital employed1) was 31.8% (29.2).
The operating cash surplus amounted to SEK 5,314m (5,018). Operating cash flow amounted to SEK 4,723m (3,792).
Capital expenditures amounted to SEK 1,896m (1,743).
Targets
- Annual organic sales growth of 5–7%
- Return on capital employed of 30% over a business cycle
Outcome 2016
Organic sales
+3%
Adjusted return on capital employed1)
31.8%
1) Excluding items affecting comparability.
Net sales by product segment
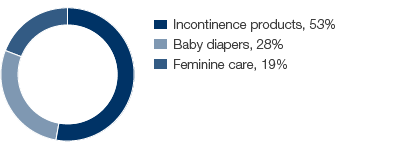

SCA’s sales to retailers’ brands as a proportion of total sales:
Incontinence products, 1%
Baby diapers, 36%
Feminine care, 6%
Net sales by region

|
SEKm |
2016 |
2015 |
||
|
||||
|
Net sales |
33,651 |
34,344 |
||
|
Operating cash surplus |
5,314 |
5,018 |
||
|
Change in working capital |
289 |
–314 |
||
|
Current capital expenditures, net |
–805 |
–840 |
||
|
Other operating cash flow |
–75 |
–72 |
||
|
Operating cash flow |
4,723 |
3,792 |
||
|
Adjusted operating profit 1) |
4,255 |
3,990 |
||
|
Adjusted operating margin, % 1) |
12.6 |
11.6 |
||
|
Capital employed |
13,665 |
13,148 |
||
|
Adjusted return on capital employed, % 1) |
31.8 |
29.2 |
||
|
Strategic capital expenditures |
|
|
||
|
plant and equipment |
–1,091 |
–903 |
||
|
company acquisitions/divestments |
197 |
23 |
||
|
Average number of employees |
13,154 |
12,688 |
||
|
No. of employees at Dec. 31 |
13,072 |
12,700 |
||
Emerging markets accounted for
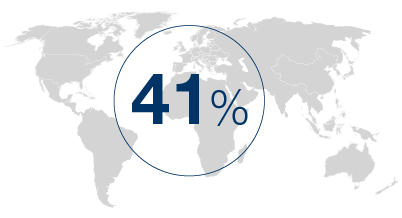

of the business area’s net sales in 2016. In emerging markets, organic sales increased by 3% in 2016.
Net sales and adjusted operating margin1)
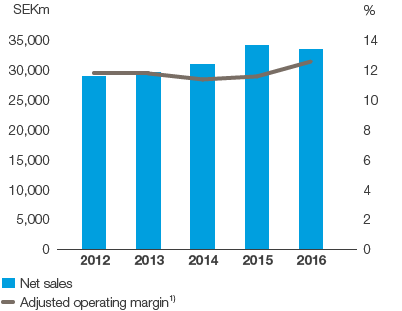

1) Excluding items affecting comparability.
2012 and 2013 restated in accordance with IFRS 10 and 11.
Adjusted operating profit and adjusted return on capital employed1)
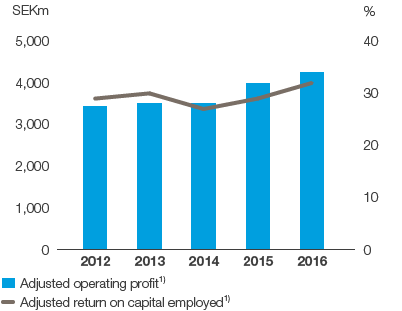

1) Excluding items affecting comparability.
2012 and 2013 restated in accordance with IFRS 10 and 11.