Sales and earnings
SCA’s adjusted operating profit1) for 2016 rose 7% compared with the preceding year (8% excluding currency translation effects, acquisitions and divestments). Higher volumes, better price/mix, cost savings, lower raw material and energy costs, and acquisition contributed to the earnings increase.
Net sales
SCA’s net sales for 2016 increased 2% compared with the preceding year and amounted to SEK 117,314m (115,316). Organic sales, which exclude exchange rate effects, acquisitions and divestments, increased by 2%, of which volume accounted for 1% and price/mix for 1%. Organic sales were in line with the previous year in mature markets and increased by 7% in emerging markets.
Profit
SCA’s adjusted operating profit for 2016, excluding items affecting comparability totaling SEK –2,710m (–2,067), increased 7% compared with the preceding year and amounted to SEK 13,989m (13,014).
Financial items decreased to SEK –919m (–955). The decrease was attributable to lower interest payments and positive currency translation effects. Adjusted profit before tax1) rose 8% to SEK 13,070m (12,059). The average tax rate for year’s profit, excluding items affecting comparability, was 36.5%. The tax rate excluding items affecting comparability and excluding a tax provision of approximately SEK 1.3bn, in part related to ongoing tax cases in Sweden and Austria, was 26%. Adjusted profit for the period, excluding items affecting comparability after tax of SEK –2,283m (–1,301), amounted to SEK 8,295m (8,753). Profit for the period amounted to SEK 6,012m (7,452). Adjusted earnings per share1) attributable to owners of the Parent amounted to SEK 11.18 (11.82). Earnings per share amounted to SEK 7.93 (9.97).
Key figures
The Group’s gross margin1) amounted to 26.9% (25.9) and the adjusted operating margin1) was 11.9% (11.3). Adjusted return on capital employed1) improved to 12.5% (12.0). Adjusted return on equity1) was 11.0% (11.6). The interest coverage ratio increased to 12.3 (11.5).
1) Excluding items affecting comparability.
SEKm |
2016 |
2015 |
2014 |
||||||||
|
|||||||||||
Net sales |
117,314 |
115,316 |
104,054 |
||||||||
Adjusted operating profit 1) |
13,989 |
13,014 |
11,849 |
||||||||
Items affecting comparability 2) |
–2,710 |
–2,067 |
–1,400 |
||||||||
Operating profit |
11,279 |
10,947 |
10,449 |
||||||||
Financial items 3) |
–919 |
–955 |
–961 |
||||||||
Profit before tax |
10,360 |
9,992 |
9,488 |
||||||||
Adjusted profit before tax 1) |
13,070 |
12,059 |
10,888 |
||||||||
Tax 4) |
–4,348 |
–2,540 |
–2,420 |
||||||||
Profit for the period |
6,012 |
7,452 |
7,068 |
||||||||
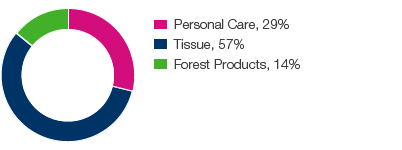
Net sales, share of Group

Adjusted operating profit and adjusted operating margin1)
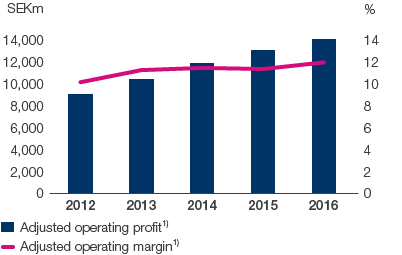

1) Excluding items affecting comparability.
2012 and 2013 restated in accordance with IFRS 10 and 11.
Adjusted earnings per share after dilution effects1)
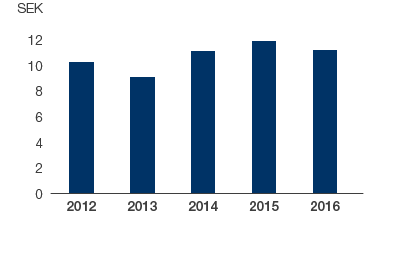

1) Excluding items affecting comparability.
2012 and 2013 restated in accordance with IFRS 10 and 11.