D3. Biological assets
AP ACCOUNTING PRINCIPLES
The Group’s standing timber is defined and recognized as biological assets at fair value in accordance with IAS 41 Agriculture and IFRS 13 Fair Value Measurement. Forest assets are divided up and recognized as biological assets and land assets in accordance with IAS 16 Property, plant and equipment. Forest land and forest roads are classified as land and land improvements. The fair value of the Group’s standing timber is calculated as the present value of anticipated future cash flows from the assets before tax and classified at Level 3 in accordance with IFRS 13. The calculation is based on existing, sustainable felling plans and assessments regarding growth, timber prices, felling costs and silviculture costs, including costs for statutory replanting. Environmental restrictions and other limitations are taken into account and the calculation is performed for a production cycle that SCA estimates at an average of 100 years. The discount rate is based on a normal forest company’s weighted average cost of capital (WACC).
The change in value is recognized in profit or loss in cost of goods sold.
KAA KEY ASSESSMENTS AND ASSUMPTIONS
Since a market price or other comparable value does not exist for assets of the scope owned by SCA, biological assets are measured at the present value of anticipated future cash flows. Key assessments and assumptions pertain to future wood prices, felling costs, felling volumes and discount rates. As of 2014, expected future felling volume and growth are based on the forest survey conducted between 2012 and 2013. A new forest survey is performed every eight years. The calculation of future income and expenses is based on the trends of these items over the most recent five-year period. TD3:1 describes the sensitivity of the carrying amount with respect to key assumptions.
SEKm |
2016 |
2015 |
2014 |
Value, January 1 |
30,119 |
29,685 |
28,767 |
Purchases and forest swaps |
17 |
33 |
375 |
Sales |
–55 |
–75 |
–72 |
Other changes in fair value |
1,472 |
1,549 |
1,646 |
Change due to felling |
–783 |
–1,073 |
–1,031 |
BS Value, December 31 |
30,770 |
30,119 |
29,685 |
Deferred tax related to standing forest |
6,769 |
6,626 |
6,531 |
The change in fair value and change due to felling are recognized as a net value in profit or loss under cost of goods sold, amounting to SEK 689m (476; 615). The unrealized change in value recognized during the year for assets held on the reporting date is estimated at SEK 1,472m.
For the valuation of standing timber, the same valuation model was used as in the past. For the 2016 valuation, the WACC was reduced from 6.25% to 5.25% as an adaption to the lower interest rate environment in Sweden. The lower WACC yielded a value increase of approximately SEK 7,100m. Assessed income and expenses are adjusted upward by an annual inflation rate of 2%. Assumptions regarding future price and cost levels have, in valuations in previous years, been based on the outcome for the ten preceding years. Application of the ten-year average yields prices and costs that are relatively far from current levels. The assumptions concerning prices and costs are therefore based instead on the average historical outcome over five years. The adaptation to the five-year average has yielded a value decrease of about SEK 6,700m. The 2016 valuation used an average wood price of SEK 432 (467) per solid cubic meter under bark (m3sub). Annual harvesting is expected to rise over the calculated future production cycle and amount to 4.3 million m3sub for 2017, ending at 5.9 million m3sub by 2116.
On average, 89% of felling comprises final harvesting and 11% thinning. 56% is expected to comprise sawlogs and 44% pulpwood.
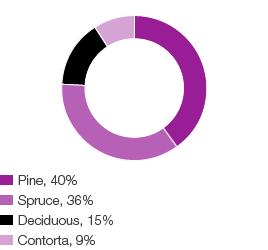
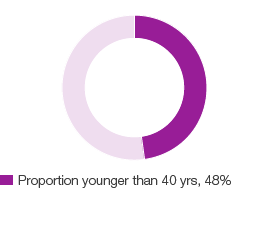
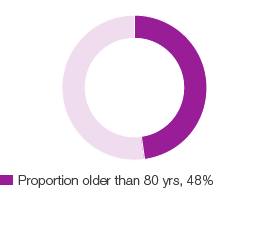
SCA’s forest holdings comprise approximately 2.6 million hectares of forest land primarily in northern Sweden, of which approximately 2.0 million is productive forest land. The timber volume of the forest portfolio amounts to 230 million cubic meters of forest (m3fo) and is divided into types of trees according to the diagram below. Growth amounts to approximately 9.5 millions m3fo per year on the productive land. Net growth, i.e. gross growth less felling and losses due to natural causes is expected to be 3.0 million m3fo per year. Felling in 2016 amounted to approximately 4.1 million m3sub.
|
2016 |
2015 |
2014 |
Value/hectare productive forest land, SEK |
15,385 |
15,060 |
14,843 |
Value timber supplies SEK/m3fo |
134 |
136 |
136 |
|
|
|
|
Change in value, before tax |
||
SEKm |
Change in assumption |
|
|
2016 |
2015 |
2014 |
WACC |
0.25% |
+ / – |
|
2,238 |
1,805 |
1,770 |
Wood price |
0.50% the first 10 years |
+ / – |
|
2,884 |
2,309 |
2,264 |
Felling cost |
0.50% the first 10 years |
+ / – |
|
742 |
494 |
397 |
Volume (final felling) |
150.000 m3sub the first 10 years |
+ / – |
|
412 |
463 |
456 |
Forest area

Timber volume

Forest portfolio